The graph below can give some understanding in what is presented as result for a typical EPR experiment, here for spin 1/2 particles. The horizontal axis is the angle setting for the filter of Alice. Backwards is the same property for Bob (although the numbers on the axis are missing). The wave is the QM expectation of the correlation of the results obtained by the detector of Alice and those of Bob. (When analyzing a real experiment of course the results obtained by the equipment are used.)
The graph that is normally presented as result of a real experiment is the correlation projected on the slice that is indicated with the red window, thereby grouping the results for each angle difference between Alice's and Bobs polarizer (The same graph that I present in New spin-half particle EPR simulation).
An extra step of data manipulation might be to make no difference between positive and negative angle differences. This can be interpreted as mirroring one of the 'wings' of the graph so that it data covers the other 'wing'.
Finally an experimentalist might only show one S part of the cos, having a difference in angles between 0 and 90 degrees (this is enough to show the difference between the classical and the QM expectation), but might even rearrange data collected at higher angle differences, assuming these parts of the cos are symmetric.
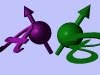
In consultation with Gordon Watson I have created a new simulation (v0.9) that involves an EPR experiment using spin-half particles. The interface shows more intuitively the settings that can be used to get results for different pairs of angles for Alice's and Bob's Stern Gerlach magnet filters:
The simulation uses Visual Studio 2010 (C-sharp Express) and can be downloaded from Sourceforge at
http://sourceforge.net/projects/epr-bohm/files/SGM_Bell.zip/download
.